Brain Research
Early care of acute hyperglycemia benefits the outcome of traumatic brain injury in rats
Objective: Previous animal studies showed contradictory to clinical observations on whether acute hyperglycemia contributes to poor outcome in traumatic brain injury (TBI). We tried to clarify this issue. Methods: Striking with depths of 3.0-4.25 mm at right Occipitoparietal brain region and with depth of 3.75 mm at right/left Occipitoparietal or right/left frontoparietal brain region were performed, respectively. Blood glucose and insulin levels were traced every four hours from 1 to 72 hours after striking. HOMA2-%S and HOMA2-%β were calculated. Modified neurological severity scores (mNSS) were used to evaluate neurological deficit within 72 hours. Results:Striking with depths of 3.5-4.25 mm induced increase in blood glucose lasting up to 24 hours after striking. The levels of blood glucose after striking with depths of 3.75-4.25 mm were significantly different from that of striking with the depth of 3.0 mm. Striking with depth of 3.75 mm at right/left Occipitoparietal region induced higher blood glucose in 24 hours than that at right/left frontoparietal region. Insulin concentration increased slowly during 72 hours after striking. Striking also induced decrease in insulin sensitivity and secretion lasting 72 hours. Evaluation of mNSS revealed that severe striking (beyond 3.75 mm) worsened nerve function than slight striking (<3.0 mm). Intervention of acute hyperglycemia could decrease the mNSS from 2-7 days after TBI. Conclusion: Our results suggested that only severe TBI could induce acute hyperglycemia by itself, and early care of acute hyperglycemia could benefit the outcome of TBI patients.
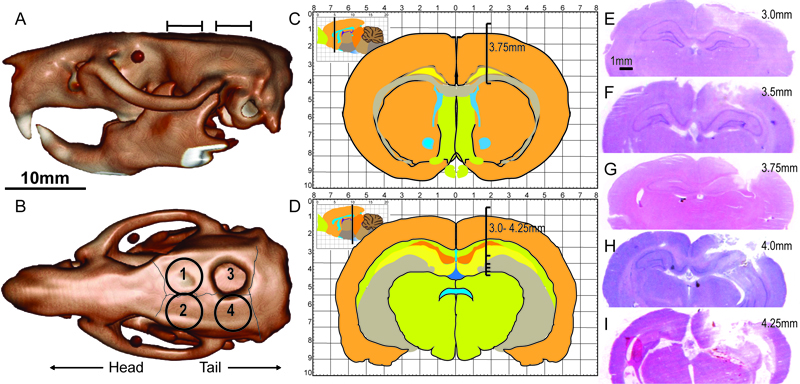
Fig. 1. Sketch map of striking sites and depths. The lateral view (A) and top view (B) of rat skull indicating the striking sites. The four striking sites were right/left frontoparietal region (1 and 2) located at the corners of lambdoidal suture and sagittal suture or right/left Occipitoparietal region (3 and 4) located at the corners of sagittal suture and coronal suture. The hole on the skull was 5 mm diameter. Bar=10mm. The striking depths in frontoparietal region are indicated with stereotaxic atlas (C). The starting point of bar in stereotaxic atlas (C and D) is the location of the endocranium. The H-E staining (E-I) showed striking depths with 3.0 mm (E), 3.5 mm (F), 3.75 mm (G), 4.0 mm (H) and 4.25 mm (I) separately. Bar=1mm.
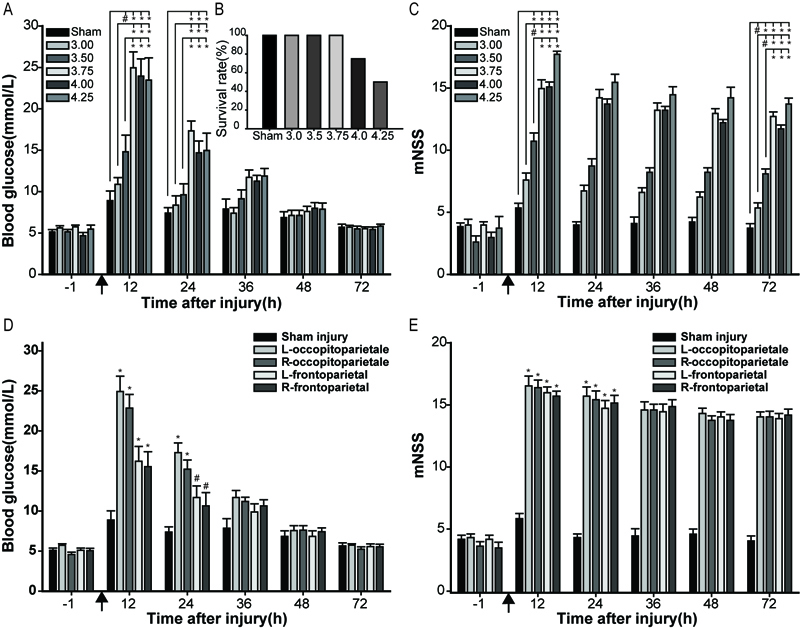
Fig. 2. Effect of striking sites and depths on the level of blood glucose and 24-hour survival rate. (A) The influence of striking depth on blood glucose when the striking site is on right Occipitoparietal region. (B) The 24-hour survival rate decreased when the striking depths increased. (C) Striking site affected the mNSS from 12 to 72 hours. (D) Striking sites affected the blood glucose and (E) mNSS of different striking sites. *P<0.01, #P<0.05, as compared to the sham group.↑ indicated TBI.
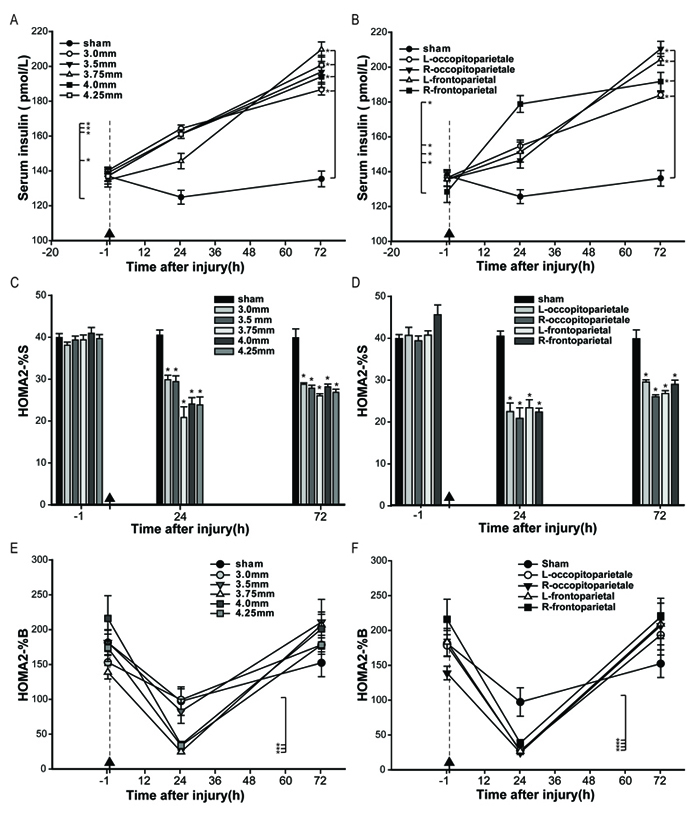
Fig. 3. Blood insulin concentration and calculation of insulin resistance index- HOMA2-%S and HOMA-%β before and after TBI. Concentration of blood insulin (A), HOMA2-%S (C) and HOMA2-%β (E) at 1 hour before TBI, and 24 and 72 hours after TBI with different striking depths. Concentration of blood insulin (B), HOMA2-%S (D) and HOMA2-%β (F) at 1 hour before TBI, 24 and 72 hours after TBI with different striking sites. ↑ and dotted lineindicated the time of TBI. *P<0.01.
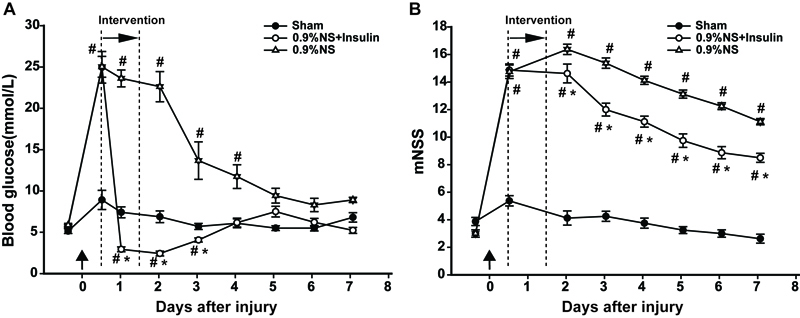
Fig. 4. Continual insulin administration could diminish acute hyperglycemia and decrease the mNSS after TBI. Insulin was administrated continually from 12 to 36 hours after TBI. (A) Blood glucose test indicated that insulin administration could diminish acute hyperglycemia; (B) Insulin administration decreased mNSS from 2-7 days after TBI. #P<0.05, as compared to sham *P<0.05, as compared to 0.9% normal saline (0.9% NS).↑ indicated TBI. Double dotted-line indicated the insulin intervention period.